MA, MATR, ChEx | All in One - 4CR CUPIn trade position setup, we always need to determine the market structure and manage the position sizing in a short period of decision time. Indicators such as moving average, initial stop loss and trailing stop loss are always helpful.
This indicator put all these handy tools into a single toolkit, which includes the following price action and risk management indicators:
MA - Moving Average
MATR - Moving Average less Average True Range
ChEx - Chandelier Exit
This script further enhances the setting so that you can easily customize the indicators.
For both the Moving Averages and the Moving Average less Average True Range , you can pick a type of moving average which suits your analysis style from a list of commonly used moving average formulations: namely, EMA , HMA , RMA, SMA and WMA , where EMA is selected as default.
The Moving Average less Average True Range , MATR, is usually applied as a reference to set the initial stop loss whenever opening a new position.
The abbreviation, MATR, is picked, so that this can serve as a handy reminder of a very good trading framework as elaborates as below:
M – Market Structure
A – Area of Value
T – Trigger
R – Risk Management (aka. Exit Strategy)
Komut dosyalarını "stop loss" için ara

White MAThis modified indicator just based on my 2cent strategy & experience,
which is:-
MA6, MA20, MA50, MA200
However, I always turn off MA20 since I also use BB (20) indicator.
Generally, if small MA cross up big MA, then it becomes entry signal, & vice versa
Each entry signal need confirmation state which is next price should close higher than crossing price.
If price close lower than crossing price, then it will be invalid entry's signal,
while if price keep maintain at same value, then it's mean uncertain for me until it close whether above or below crossing price.
"Strategy 1" (General)
In TF1D, the pattern should fulfill my condition as below:-
- MA20 above MA50 (bullish uptrend)
- Price pullback at least touch MA20 for reversal (making Higher Low)
- Price break resistance of pullback's price
My entry signal only after it close above the resistance, near "support" (RBS, Resistance become Support)
My stop-loss, if and only if price touch previous SMA6 price (or SMA10)
Unfortunately, I haven't had any specific target price. It's depending on what kind of "player" you are. (achievement)
Few TPs those I used:-
- Price touch my Static Resistance on chart obtained from,
~ Pullback price
~ Fibo (1.61++)
~ Higher price in 3 months, 6 months, 1 year, 3 year, and so on. (road to ATH, All Time High)
- Price close outside Upper BB (Dynamic Resistance)
I don't assume sell signal by using crossing indicator as TP, it's more to stop-loss for me. (means stop from loss your profit)
"Strategy 2" (Reversal Entry)
In TF15 minutes, we are assuming entry signal when SMA6 cross up SMA50. However, it's still need confirmation by next closing price.
This strategy can be apply in TF1D although SMA20 doesn't cross up SMA50 yet.
That's all my sharing strategy/system based on my 2cent experience, it's not a prefects strategy but I hope it will gives some idea for you guys in order to obtain your own system.

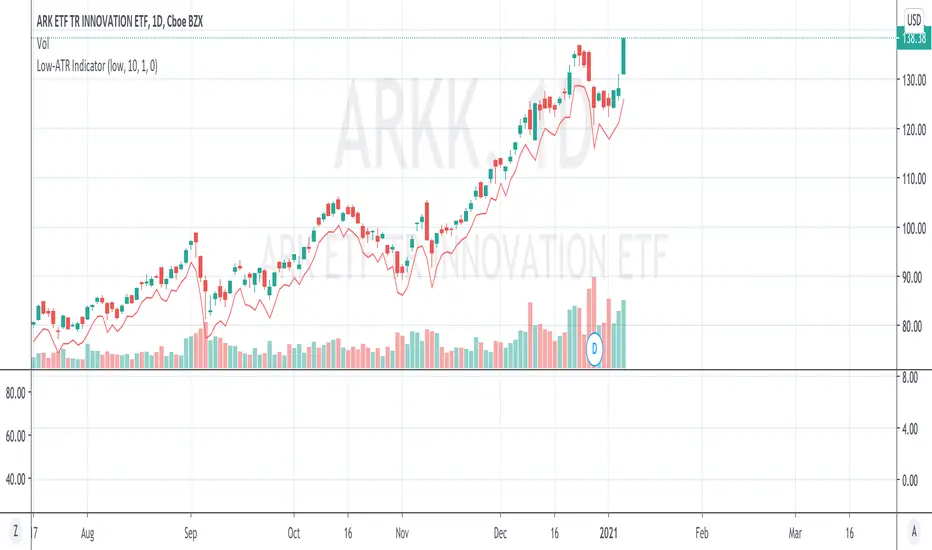
Low-ATR IndicatorWe often want to use a stop loss at a certain low - N*ATR,
But it is too troublesome to manually calculate a certain day low - ATR.
This indicator simply calculates it for you, by marking the value of day low - ATR.
By default the hardcoded ATR value is 0, which means "Uses the ATR at that day with configured look back period".
If you want to use a specific ATR value, e.g.
1) You want to set the stop loss using today's ATR but another day's day low (Very often)
2) You want to set the stop loss in another timeframe - N*ATR
You can type in the value of ATR into the "hardcoded ATR" field.
(Actually this should be the most used way)
Position/stops calculation for controlled trade.Calculate your position and stop loss directly within the trading view chart.
parameters:
Wallet Balance ==> represent you trading account wallet balance
Stop loss purcentage from entry ==> represent the pourcentage of the stop loss from the entry
risk purcentage per trade ==> represent the percentage of you wallet balance you are willing to loose after taking position in a trade, it is advisable to use a maximum risk of 3% or even much less.

Hikkake PatternLifted description from web:
Hikkake means to trap, trick, or ensnare. Primarily, this price pattern seeks to identify inside bar breakouts and profit from their failures.
An inside bar is a price bar that is entirely within the range of the preceding price bar. Inside bars are typical on price charts of most timeframes.
While you’ll often find inside bars in congested markets, they also offer a low-risk entry point for price action traders. The contracted range of an inside bar offers a natural tight stop-loss.
Hence, inside bar breakouts seem attractive. However, if you are patient and focus on identifying false breakouts, you might be able to find more reliable trading setups in the form of Hikkakes.
In a nutshell, the Hikkake pattern offers a systematic approach to trading false inside bar breakouts.
As a filter I incorporated VWAP into the code to only trigger Bullish / Bearish signals when price is Above/Below VWAP respectively. The ATR is used to create a Stop buffer (red cross) for the Entry signal ( green dot ). The R1 and R2 (orange squares) are two possible profit targets that are customizable to different Risk multiples based upon the difference between Entry and Stop.

Trend Trade ( in W, D, H, 15M )Condition:
Uptrend, EMA5 > EMA8 > EMA13
Downtrend, EMA5 < EMA8 < EMA13
EMA# input can be changed by user.
Trading Plan:
1. Long in Uptrend when Price croseover EMA5;
Buy EMA5 + 0.03 (Do not wait for close), initial stop EMA13-0.03
If it is a big Gap up, do not chase. Let it go;
2. Short in Downtrend when Price croseunder EMA5;
Short EMA5 - 0.03 (Do not wait for close), initial stop EMA13+0.03
If it is a big Gap Down, do not chase. Let it go;
3. No target strategy in this study;
Back test Weekly, daily, hourly, 15M chart for ES1!, CL1!, GC1!, SPY, QQQ, TLT, IWM, XLF, XLK, XOP, GS, IBM, APPL, AMD, MMM, WBA
When side way move, Entry could be stopped quickly with small loss;
When entry in trending move, the position could be hold for a good range, and keep adding to winner.
Using this study, Futures and ETFs are better than single stock. Big Gap can break the trend, and trigger big stop loss;
This study is designed to join an existing trend. Try not use this in the time frame below 15 min.
To catch the turning point of a swing, Price action (Demand/Supply Confirmation) and trendlineBreak could be more accurate than EMA/SMA lines.

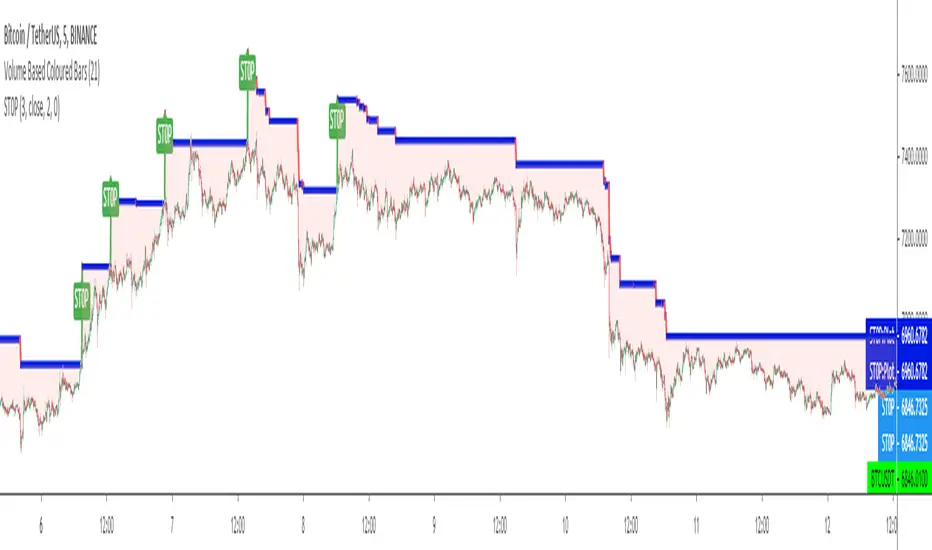
ST0PST0P is a kind of a TRAILING STOP LOSS INDICATOR in which users can set up LONG or SHORT trade versions and also can set up a STOP LOSS level by percent % or unit difference.
It tries to solve the problem of stop loss indicators' default BUY or SELL settings and non adjustable stop levels of % and difference change in price levels.
(Will try to make updates to add user defined start bars.)
Kıvanç Özbilgiç
inwCoin Specific Buy/Sell Price Alert for AutoviewJust simple script to act as conditional stop loss
Problem : Traditional Market Stop or Limit Stop, you have to set it with specific price and wait for the price to drop/pump to your stop then it will trigger. But sometime ( so many times ) the price will leave a very long wick up or down to hunt the stoploss that already set in the exchanges.. then it turn back to the opposite side after stop our position from existent!!
Thank to Autoview, with this simple script, you can setup your "stop level" without put "stop market" in the order.
Just stop when price close below or above specific level in the script, then you can just setup alert to fire the TP/Stop order to exchange via autoview after alert fire.
Example;
You need to stop loss / TP your position when price "close below 9500" in daily BTC chart
- Just set "sell price" to 9500
- and set "Cross down" option
When daily chart close below 9500, the script will trigger alert for you to catch and send to any exchange via Autoview.
Note;
1) When setting alert in tradingview, make sure to use..
- Crossing Down + 0.8 in alert trigger condition
- Set to "Once per bar" ( If you set "once per bar close", it will fire alert in next 2nd candle! )
2) You need to subscribe to autoview to use the bot. And it's not for everyone. Just do your own research before using! ( try to test with small amount of money first! )
Cheers!

[fikira] Harmonic Patterns 2This is "Harmonic Patterns", part 2 Open Source
(in 2 parts, otherwise many lines are gone because the script is too large):
- Crab
- Bat (+ Alt)
- Butterfly
- Shark
A "Pattern" is created by checking 5 consecutive ( pivot ) points, starting with X, A, B, C, and ending with point D.
At point D all 5 points are compared, calculated and verified.
When confirmed, a "Label" will be plotted at point D, together with the "Entry", "Take Profit" and "Stop Loss" price.
The "Entry", "Take Profit" and "Stop Loss" lines will be plotted as well at point D.
Lastly, a "Drawing" automatically will be displayed which makes the "Pattern" visible.
Please do mind, the "Drawing" is calculated differently, the "Drawing" sometimes can be displayed incorrectly
when prices are too close to each other (for example low Satoshi price changes).
THE "ENTRY", "TAKE PROFIT", "STOP LOSS" PRICES AND LINES ARE NOT AFFECTED AT ALL BY THIS, THEY WILL SHOW CORRECTLY!
- 1 "TP point" can be changed ("TP Level 0.618")
- "Labels", "Lines", "Drawings" can be disabled/enabled
- "Labels" can be made smaller or bigger ("Size Label")
- "Labels" can be placed further or closer to the bar ("Distance TP Label" > higher = closer, lower = further)
- "Lines" can be made thicker or thinner ("TP Linewidth")
- "Drawings" can be made thicker or thinner ("Drawings Linewidth")
- "Drawings" are created by comparing with 100 bars back in history (default), should it be (very rarely) a triangle is displayed flat on the left side,
possibly the first point(s) is/are further than 100 bars ago, in this case increase "Period Drawings" above 100.
- Animal symbols can be enabled/disabled
- When several "Patterns" appear on the chart, the oldest ones won't be displayed anymore, first the "Drawings", then the "Lines"
The last (present) ones will always be displayed in total without a problem!
- If you want to see "Patterns" with less correct measurement, change "Error Marge" 0.9 - 1" and "Error Marge" 1 - 1.1"), this gives max. about 10% extra margin
- Added more settings regarding "Drawing Lines"
Thank you very much!

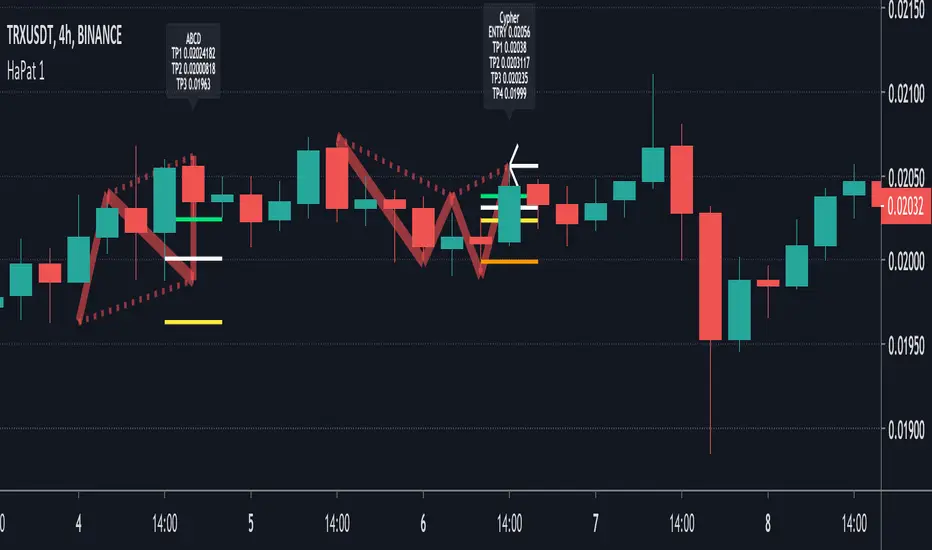
[fikira] Harmonic Patterns 1When using "Harmonic Patterns", always look at the bigger picture, please do not depend solely on the "Pattern".
Use other indicators,... to confirm what you think is going on!
That said, it is quite useful!
Beside my "The Gartley", now, OPEN SOURCE, we have "Harmonic Patterns" in 2 parts (otherwise many lines are gone because the script is too large)
- ABCD
- Gartley
- Cypher
- 5.0
A "Pattern" is created by checking 5 consecutive ( pivot ) points, starting with X, A, B, C, and ending with point D.
At point D all 5 points are compared, calculated and verified.
When confirmed, a "Label" will be plotted at point D, together with the "Entry", "Take Profit" and "Stop Loss" price.
The "Entry", "Take Profit" and "Stop Loss" lines will be plotted as well at point D.
Lastly, a "Drawing" automatically will be displayed which makes the "Pattern" visible.
Please do mind, the "Drawing" is calculated differently, the "Drawing" sometimes can be displayed incorrectly
when prices are too close to each other (for example low Satoshi price changes).
THE "ENTRY", "TAKE PROFIT", "STOP LOSS" PRICES AND LINES ARE NOT AFFECTED AT ALL BY THIS, THEY WILL SHOW CORRECTLY!
- 1 "TP point" can be changed ("TP Level 0.618")
- "Labels", "Lines", "Drawings" can be disabled/enabled
- "Labels" can be made smaller or bigger ("Size Label")
- "Labels" can be placed further or closer to the bar ("Distance TP Label" > higher = closer, lower = further)
- "Lines" can be made thicker or thinner ("TP Linewidth")
- "Drawings" can be made thicker or thinner ("Drawings Linewidth")
- "Drawings" are created by comparing with 100 bars back in history (default), should it be (very rarely) a triangle is displayed flat on the left side,
possibly the first point(s) is/are further than 100 bars ago, in this case increase "Period Drawings" above 100.
- When several "Patterns" appear on the chart, the oldest ones won't be displayed anymore, first the "Drawings", then the "Lines"
The last (present) ones will always be displayed in total without a problem!
- If you want to see "Patterns" with less correct measurement, change "Error Marge" 0.9 - 1" and "Error Marge" 1 - 1.1"), this gives max. about 10% extra margin
- Added more settings regarding "Drawing Lines"
Thank you very much!
Jurik Moving Average Crossover Strategy [ChuckBanger]The classic moving average crossover strategy does not work well in markets that, instead of trending, tend to frequently reverse within a trading range. The lag between the actual time the market has reversed direction and when the moving average is signalling a trade, the trend is already over and the market is about to go against your position. In this environment, a more appropriate trading strategy is suggested here using an JMA Keltner Channel.
The idea is to create a channel based of support and resistance. When the market breaks out of the channel, and fails to maintain momentum. It is likely the price will fall back toward the center of the channel. This tendency can be exploited in the following manner.
In the chart above, The aqua and maroon (center line) and the blue lines are part of a channel. The middle line is a slow running JMA of the closing prices, with Length = 30 and phase = 0. The upper blue band is constructed by adding 1.5 times of 30-bar ATR (average true range) to the center JMA line and the lower blue band by deducting the same amount. There is a grey line running through the data- That is a fast running JMA with length = 5 and phase = 100 representing the price.
The red dots indicate that the the price is going back in the channel and the market is retracting from a failed upward breakout, and the green dots mark when price is retracting from a failed downward breakout. These are places where one might want to enter the trade. The orange dots indicate where price crosses the center line, a reasonable place to take profit from or even exit the trade.
The center line also shows the up or down movements if the setting is ticked. This feature is useful to use when exit a trade. For example, you enter a long position on a green dot signal and the color is maroon. You can wait for 3-5 candles (depending of markets). And if the color doesn’t change it can be an indication that the price is going lower. Here it is possible to switch to a short possible or the opposite apply if you enter on a red dot.
The parameter use in this study is for demonstrating purposes only. This is to show how you can use JMA. Do not trade with real money without thoroughly test the strategy. And always use stop-losses.

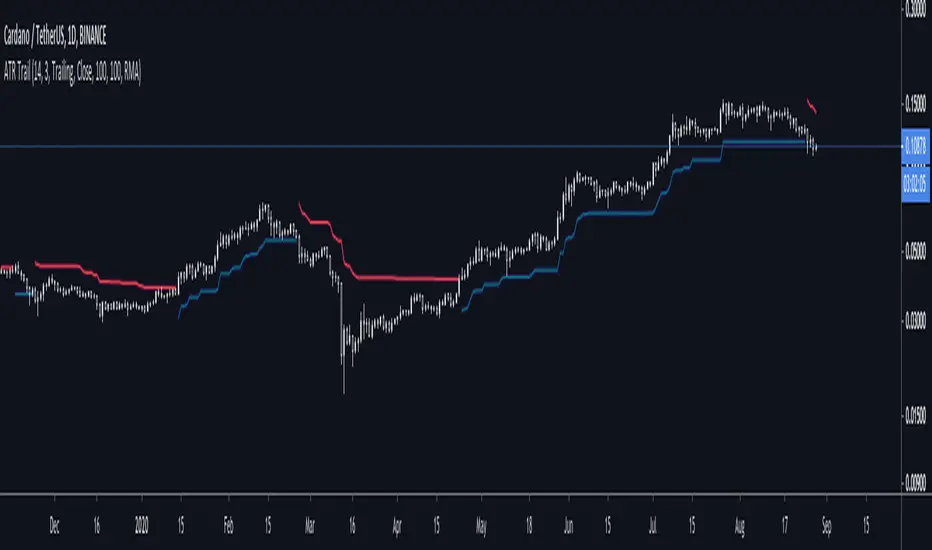
ATR + Trailing StopsSimple visualisation of Average True Range in Pinescript V4.
The script has two modes: Running and Trailing.
In Running mode, it continuously displays the ATR above and below the price. Specifically, it displays the High and Low price plus and minus the ATR times a user-supplied multiplier. This can be helpful for visualising volatility.
In Trailing mode, it displays the same ATR line, except the line trails until price crosses it. When price crosses it, it flips from long to short or vice-versa.
You could use trailing ATR as a stop loss. Adjust the multiplier and lookback period for your asset and preference.
Triangular Moving Average (TMA) bandsWhat in the world is up folks ??!??
Here's the indicator of the day. Sharing a simple one today because I'm busy coding for a few clients (fun life of a top script author on TradingView)
The TMA bands is an indicator that I discovered on FXCM a few years ago FXCM TMA bands
From the screenshot above, we see that when the price hits the lower band, it's a possible reverse BUY signal. When it hits the upper band, it's a possible SELL signal
Methodology
1) The Take Profit 1 is the middle line, Take Profit 2 is the opposite band.
2) Once the TP1 is hit, set your Stop Loss to breakeven
3) Once the TP2 is hit, if you still want to stay in the trade, set your Stop Loss to the TP1
That's what we call a trailing stop loss which I offered in the Trade Manager : Trade-Manager-Open-Source-Version/
It will be a powerful tool in your arsenal for some scalp/intraday trades
After years of coding for traders, I worked with many brokers/API/languages so I'm very used to convert a script from a broker to another one (shameless self-advertising)
PS
Tomorrow I'll share the Signal version of my Algorithm Builder:
You'll be able to connect it in a single click to a very cool Backtest System made by the Pinescripters community
In other words, I'm selling the scripts to allow you to build your own signals in a few clicks AND to connect it easily to a kick-ass backtesting tool. More to come tomorrow
Hope you'll like it, like me, love it, love me, tip me :)
____________________________________________________________
Feel free to hit the thumbs up as it shows me that I'm not doing this for nothing and will motivate to deliver more quality content in the future. (Meaning... a few likes only = no indicators = Dave enjoying the beach)
- I'm an officially approved PineEditor/LUA/MT4 approved mentor on codementor. You can request a coaching with me if you want and I'll teach you how to build kick-ass indicators and strategies
Jump on a 1 to 1 coaching with me
- You can also hire for a custom dev of your indicator/strategy/bot/chrome extension/python

™TradeChartist Fib Extensions™TradeChartist Fib Extensions is a free to use script that helps traders plot Fibonacci Extensions on chart. Even though Trading View has a Fib extensions tool, some traders may prefer a plotting script like this with Fib plot lines extending across the whole of the chart to track historic prices in relation to Fib extensions drawn.
----To draw Fib extensions for uptrend ,
1. Choose a Pivot Low point (LL or a HL) as Pivot 1
2. Choose a Pivot High point (must be higher than Pivot 1) as Pivot 2
3. Choose a Pivot Low point (must be lower than Pivot 2, must be Higher than Pivot 1)
----To draw Fib extensions for downtrend,
1. Choose a Pivot High point (HH or a LH) as Pivot 1
2. Choose a Pivot Low point (must be lower than Pivot 1) as Pivot 2
3. Choose a Pivot High point (must be higher than Pivot 2 and lower than Pivot 1)
Negative extensions of -23.6% and -61.8% fib plots may be useful for some to spot reversals or to set stop losses.
Higher levels can be used if price goes beyond 161.8%
This is a free to use indicator. Give a thumbs up or leave a comment if you like the script
Check my 'Scripts' page to see other published scripts. Get in touch with me if you would like access to my invite-only scripts for a trial before deciding on a paid access for a period of your choice. Half-Yearly, Annual and Lifetime access available on invite-only scripts along with 1hr Team Viewer intro session.

Trade Manager (Open-Source & Non-Standalone Version)Happy Friday everyone
TGIF !!!!!! The weekend for me means no script publishing and enjoying the sun
As a weekday vampire, I'll go out and try to survive the sunlight or I'll prepare the indicators to share for next week. Not sure at this point....
This week, I shared a Trade Manager Trade-Manager-Open-Source-Version/ that you need to get connected to your indicator
Some traders asked if I could give away an alternative version meaning they'll have their own indicator separately and once they'll get their signal, they'll add the Trade Manager to manage their take profits and stop losses. (I'm working for Tradingview charity apparently ^^)
I liked the idea a lot !!! I like it even more that this idea came from followera that I don't even know
How does it work ?
Basically, chose any indicator you want. Once you get your signal/alert, get in the trade with your broker, and add the Trade Manager (Non-Standalone Version) (note the Non-Standalone Version) <=
This is realy important !!
So this was defintively the Trade Manager week... I feel I shared one alternative of that tool a day. (might get banned for copy/pasting myself too much)
Not sure of how I managed it anyway but now let's summarize what you have in your trading toolkit so far :
- Trade Manager to be used DIRECTLY with another indicator : Trade-Manager-Open-Source-Version/
- Trade Manager to be used INDIRECTLY with another indicator : the one I'm sharing right now
- Risk/Reward & PnL & Errors management tool : Risk-Reward-InfoPanel/
If you want to build your own signals in a few clicks only, feel free to share my Algorithm/Strategy builder Strategy-Builder-Crypto-Single-Trend-Plots/
I made it so that you guys can build you own custom signals and then why not, plugging them to the Trade Manager and to the Risk/Reward indicators..... That's now that you're supposed to connect the dots and realizing that all indicators shared this week are deeply linked and powerful when well used together :-)
Wishing y'all a great weekend and see you Monday, well rested and fresh for a new set of indicators
_____________________________________________________________
Feel free to hit the thumbs up as it shows me that I'm not doing this for nothing and will motivate to deliver more quality content in the future. (Meaning... a few likes only = no indicators = Dave enjoying the beach)
Two good news happened this week for me
1) I'm an offically approved PineEditor/LUA/MT4 approved mentor on codementor. You can request a coaching with me if you want and I'll teach you how to build kick-ass indicators and strategies
Jump on a 1 to 1 coaching with me
2) I'm a top author Pine script :)
changes-to-script-publishing-on-tradingview-13462

Parabolic SARThis is a redesign of the built-in Parabolic SAR indicator. I added a proper input system, an option to highlight initial points for both lines and an option to choose points width. So, customize it as you want.
Parabolic SAR was originally developed by J. Welles Wilder and described in his book "New Concepts in Technical Trading Systems" (1978). It is a trend-following indicator that can be used as a trailing stop loss.
To know which settings for PSAR are the most profitable on your instrument and timeframe you can use this tool
Profitable Parabolic SAR

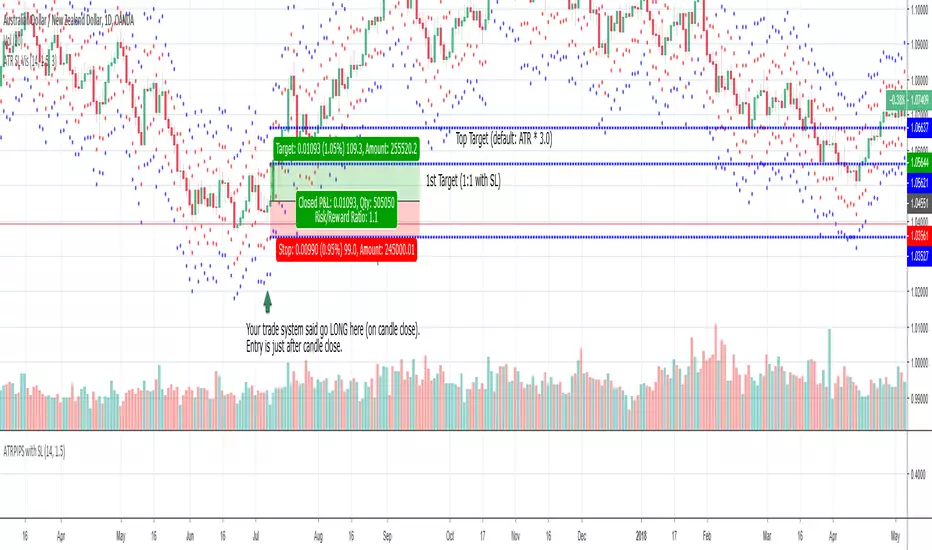
ATR SL Visualization (on chart)This indicator plots 2 sets of dots (and lines) based on your chosen ATR multiplier (Average True Range).
Generally, when trading on the daily timeframe a good rule of thumb is to use the ATR * 1.5 (the default setting of this indicator).
I created this indicator to quickly test other indicators but I also find it helpful in live trading.
How to use this indicator:
Your trade system provides an entry signal. The red dot (can be connected line in options) would be used as the stop loss for either a long or short.
Then the dot on the other side would be your first 1:1 target.
The blue line is the same ATR multiplier as a target (default but can be modified).
Using an additional tool like the horizontal ray can be helpful to see the exact location the SL might be hit or where the target might hit.
When drawing your ray ensure you’re using the right entry candle.
For instance, in a long scenario you would typically be entering a trade after your signal candle closes. So draw the ray at the point in price on the next candle for both stop loss and target.
Also use these dots (lines) as guides provides an easy way to plot SL and targets if you want to use the Long or Short tool.
For my trade systems I don’t use price targets (I exit when structure or indicators reveal to exit) but I do find it helpful to graph when testing. When something moves in my favor either the ATR or the ATR * 1.5 I take profit and typically move up my stop loss to break even or trailing.
The other strategy that could be possible but have not tested is as long as the SL is making a new high moving up a hard stop to the ATR SL each day the trade goes in your favor.
This should be obvious but if you want to use just the true ATR edit the multiplier to be 1.0
Parkinson Historical VolatilityFirst off, a huge thank you to the following people:
theheirophant: www.tradingview.com
alexgrover: www.tradingview.com
NGBaltic: www.tradingview.com
The Parkinson Historical Volatility (PHV), developed in 1980 by the physicist Michael Parkinson, aims to estimate the volatility of returns for a random walk using the high and low in any particular period. An important use of the PHV is the assessment of the distribution prices during the day as well as a better understanding of the market dynamics. Comparing the PHV and a periodically sampled volatility helps traders understand the tendency towards mean reversion in the market as well as the distribution of stop-losses.
This script allows you to transform the volatility reading. The intention of this is to be able to compare volatility across different assets and timeframes. Having a relative reading of volatility also allows you to better gauge volatility within the context of current market conditions.
For the signal lie I chose a repulsion moving average to remove choppy crossovers of the estimator and the signal. This may have been a mistake, so in the near-future I might update so that the MA can be selected. Let me know if you have any opinions either way.
References
www.rdocumentation.org
www.ivolatility.com
Want to Learn?
If you'd like the opportunity to learn Pine but you have difficulty finding resources to guide you, take a look at this rudimentary list: docs.google.com
The list will be updated in the future as more people share the resources that have helped, or continue to help, them. Follow me on Twitter to keep up-to-date with the growing list of resources.
Suggestions or Questions?
Don't even kinda hesitate to forward them to me. My (metaphorical) door is always open.

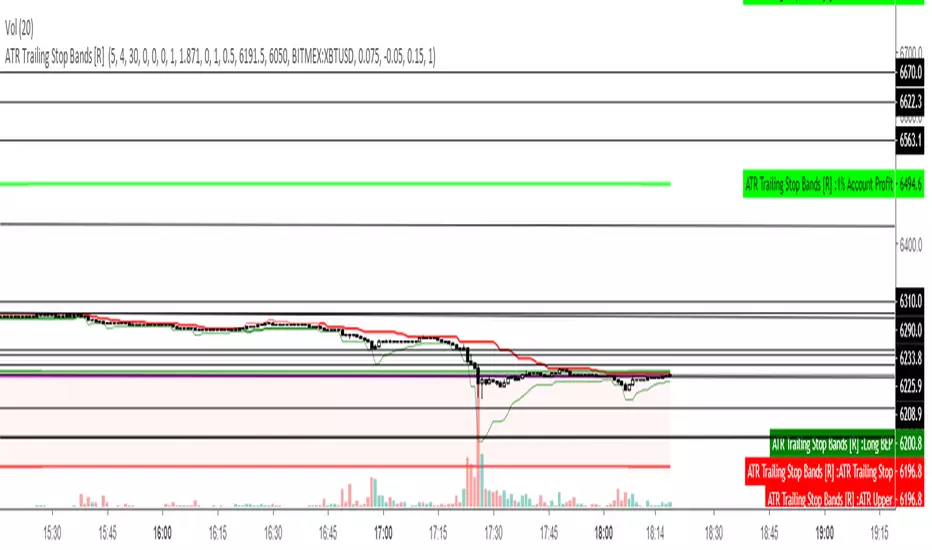
ATR Trailing Stop Bands [R] This is based on the Average True Range Trailing Stops Strategy by Sylvain Vervoort, coded on TV HPotter. I have added Bands to see potential short and long stop loss zones before the indicator signals to switch itself, also changed color on the main Trailing Stop based on whether it is short or long, added increased stop loss hunt protection by combining with my Wickiness indicator to add Wick Protection, based on either Average or Maximum Wicks, to prevent your stop getting wicked out. Experiment with different timeframes according to your trading style and how long you like to hold a trade. This indicator does not intend to tell you when to take profit, just how to place your stop to give you the best chance of not getting stopped out too early and to minimise risk by trailing it safely.
May you all never be stop hunted again.
Donchian Channel with Range AdditionA Donchian Channel with additional zones at places where its range is smaller than a set amount of atr. Thus it kind of combines with Keltner Channel qualities. Purpose is to set a stop loss wide enough to avoid shaking out of a position. The example chart shows a Philips day chart, where I opened position on 16 juli at 37,50 and set the stop loss at low border level 35,60, on 23 juli was an earnings rapport, the wick of the candle shows that quotes went very low, obviously smart traders had to fill a huge order and hunted for stops, triggering my stop closing the position. next days quotes went a lot better, so I missed the fun. The Donchian Channel was too narrow because quotes had ranged in the previous weeks. If I had placed my stop on the additional low, setting it 5 atr below the high border, my stop would have been safe.

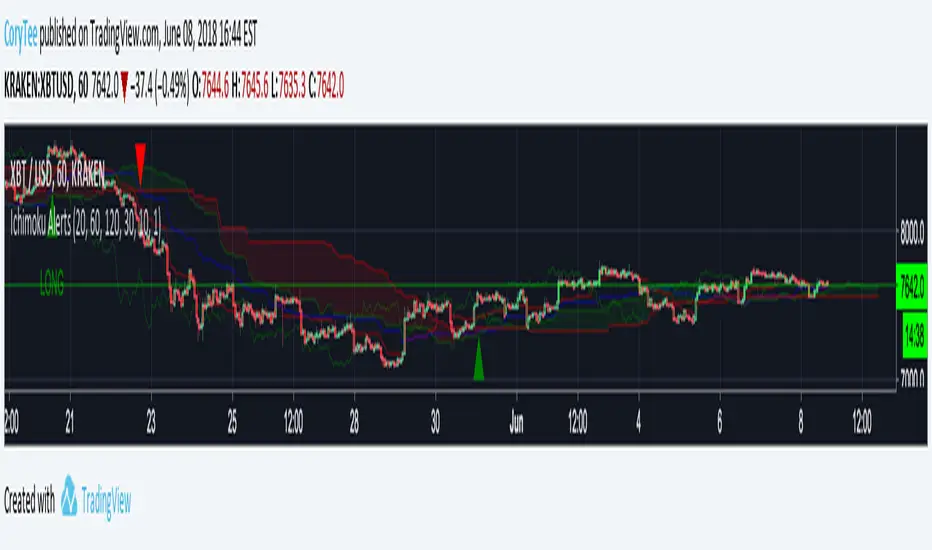
CoryT's Noro's Ichimoku AlertsA few months ago I took Noro's Ichimoku Cloud and used the AV bot template to throw stops on it. I took some code from JustUncleL
to make it not so hideous. Trailing Stops are turned off, stop losses are turned off (you really don't need them with this), and this is currently a Long/Short strategy, the Longs Only and Shorts Only options are broken right now, I'm tired and you guys can either fix it yourselves or deal with it like this for now.
Hint: If you wanna use this as a long-only strategy just have AV close your buy orders whenever a short is triggered.
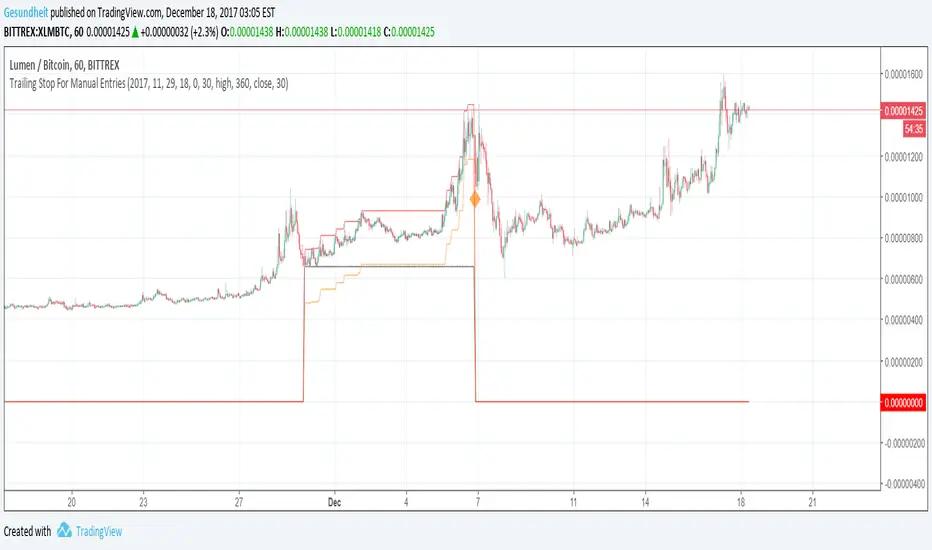
Customizable trailing Stop For Manual EntriesHere's how to create a trailing stop with a manual buy order, on an exchange that does not support native trailing stops. Code can easily be copy+pasted into your normal algos.
To set the entry price for your manual trade, specify the bar time when the trade was made. Note that the time you specify needs to correspond to an opening time on your chart--if it's a 3 hour chart, 6 pm or 9 pm will work, but 8 PM will not. It's not as bad as it sounds though, read on :)
Per usual I keep multiple options open.
Special features in this script:
Change time frame for trailing
Specify trailing parameter (high, close, hlc3, etc.)
Change time frame for stop loss trigger (use a shorter time frame for earlier exits!)
Specify trigger parameter (close, low, hlc3, etc.)
Remember that annoying issue where you might not be able to precisely specify entry price, because you want to use 3 hour closing prices for your trailing stop but you bought in at 7:41 pm? Add this indicator to a 1 minute chart and set your start time to 19:41, then set the trailing time frame to 3 hours!
Next stop is v2, where we take profits along the way before stop loss gets triggered.
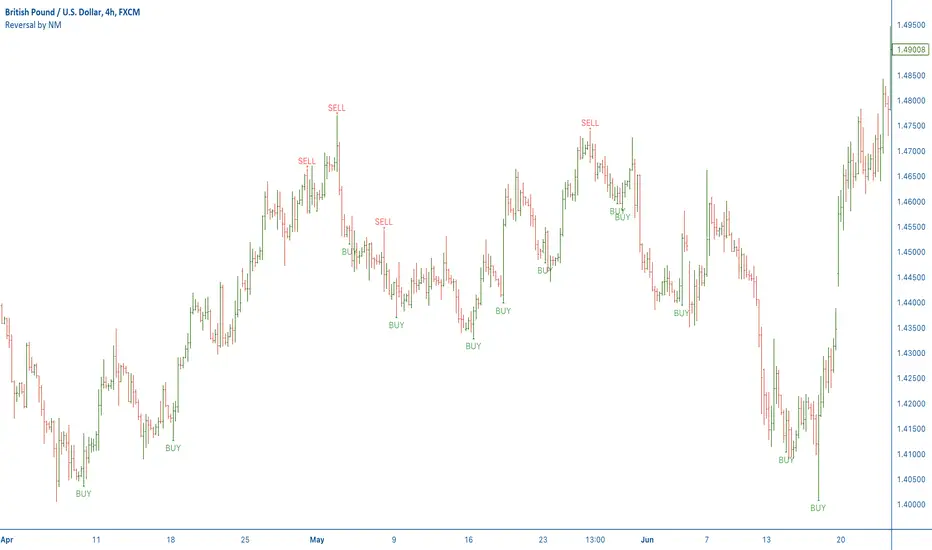
[NM] Reversal Candles v01Reversal candles are a very easy way to identify a turn in trend, this indicator has some specific additional conditions for the reversal candle.
BUY Signal reversal candle
Low of current candle exceeds low of previous candle
Low of current candle is lowest for last 7 candles
High of current candle exceeds high of previous candle
Close of current candle is in the upper 50% of the range of this candle
SELL Signal reversal candle
High of current candle exceeds high of previous candle
High of current candle is Highest for last 7 candles
Low of current candle exceeds low of previous candle
Close of current candle is in the lower 50% of the range of this candle
How do I trade it ? (example buy signal)
Wait for close of the candle and the BUY signal
Put a buy stop entry 5 pips above the high of the candle
Put a stop loss 5 pips below the low of the candle
Calculate difference between entry and stop loss and set your target that number of pips above the entry for a 1:1 RR trade*
Wait for your your target or stop loss to be triggered
* Alternatively, you can take 50% of the profit at the 1st (1:1 RR) profit target, move your stop to break even and let the rest of the position run for a higher potential profit.
Further advice on use
Personally I always look for some additional confirmation like a support or resistance level, a bounce of the EMA or a fibonacci level, but please feel free to add additional filters to make the strategy even more effective. I would strongly advise to backtest your strategy first so you can fine tune it and have confidence in trading it. Forward testing on a demo account before going live, although it takes longer, can be a worthy alternative. Works better on higher time frames.
How do you use it ?
Please leave a note in the comment section below to let me know if you use the indicator and how. There's definitely not just one way to use the indicator so I'm curious about your feedback.
To apply the script to your chart, just add it to your favourites so you can easily find it in the Indicators list.
Kindly leave me a thumbs up if you like this indicator or support my work, and do not hesitate to visit my other indicators. Thanks for your visit